- Getting started with the Partner Portal
- Devices
- Device health
- Device alarms
- Organizations
- Sub-partners
- Users
- Extra info for partners
- Release notes
- PARTNER PORTAL C10 November 2024
- PARTNER PORTAL C9 September 2024
- PARTNER PORTAL C8 September 2024
- PARTNER PORTAL C7 August 2024
- C6 July 2024
- C5 June 2024
- C4 May 2024
- C3 March 31, 2024
- C2 March 3, 2024
- C1 February 2024
- E23/24 January 2024
- E21/22 December 2023
- E19/20 November 2023
- E17/18 October 15, 2023
- E15/16 October 1, 2023
- E13/14 August 2023
- E11/12 July 2023
- E9/10 June 2023
- E7/8 May 2023
- E5/6 April 30, 2023
- E3/4 April 2023
- E1/2 February 2023
- E24/25 January 2023
- E22/23 November 2022
- E20/21 Oct 2022
- E18/19 October 2022
- E16/17 September 2022
- E14/15 August 2022
- E12/13 July 2022
- E10 May 2022
Navigate the Partner Portal as a reseller partner
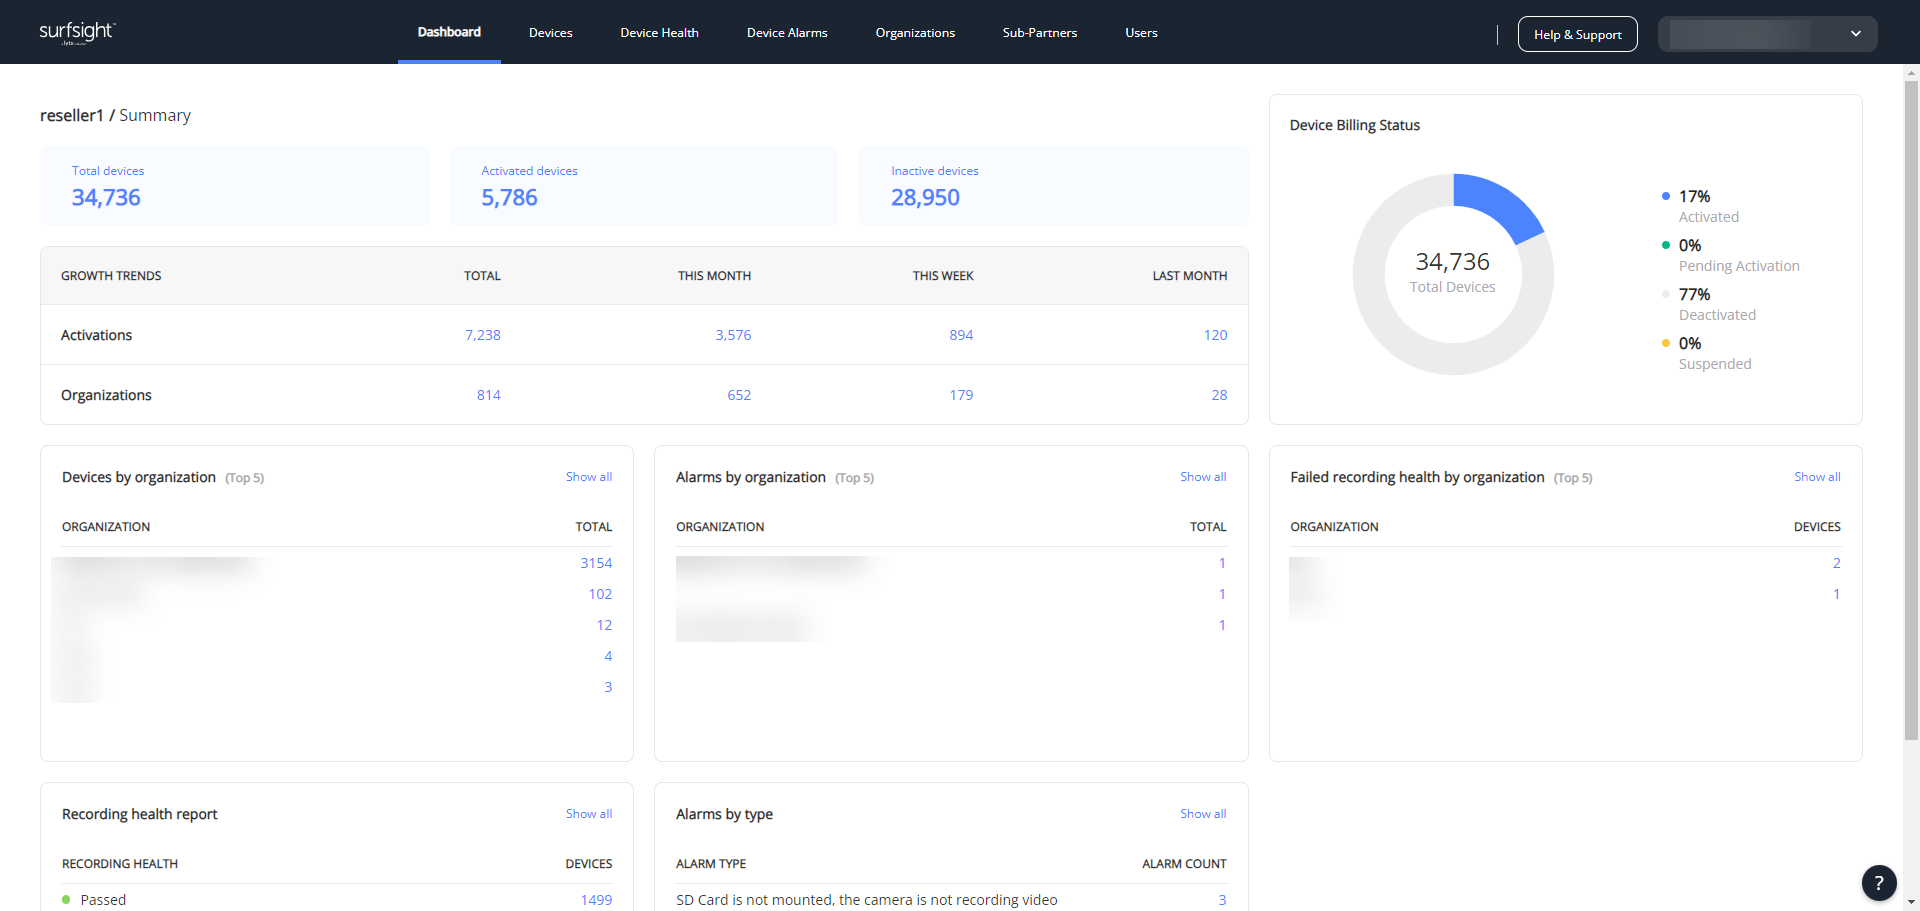
When you log into the Surfsight Portal, the default dashboard loads with an overview of your company's devices and organizations. As a partner contact, this includes all devices that you've assigned to any sub-partner as well.
Learn more about:
The dashboard
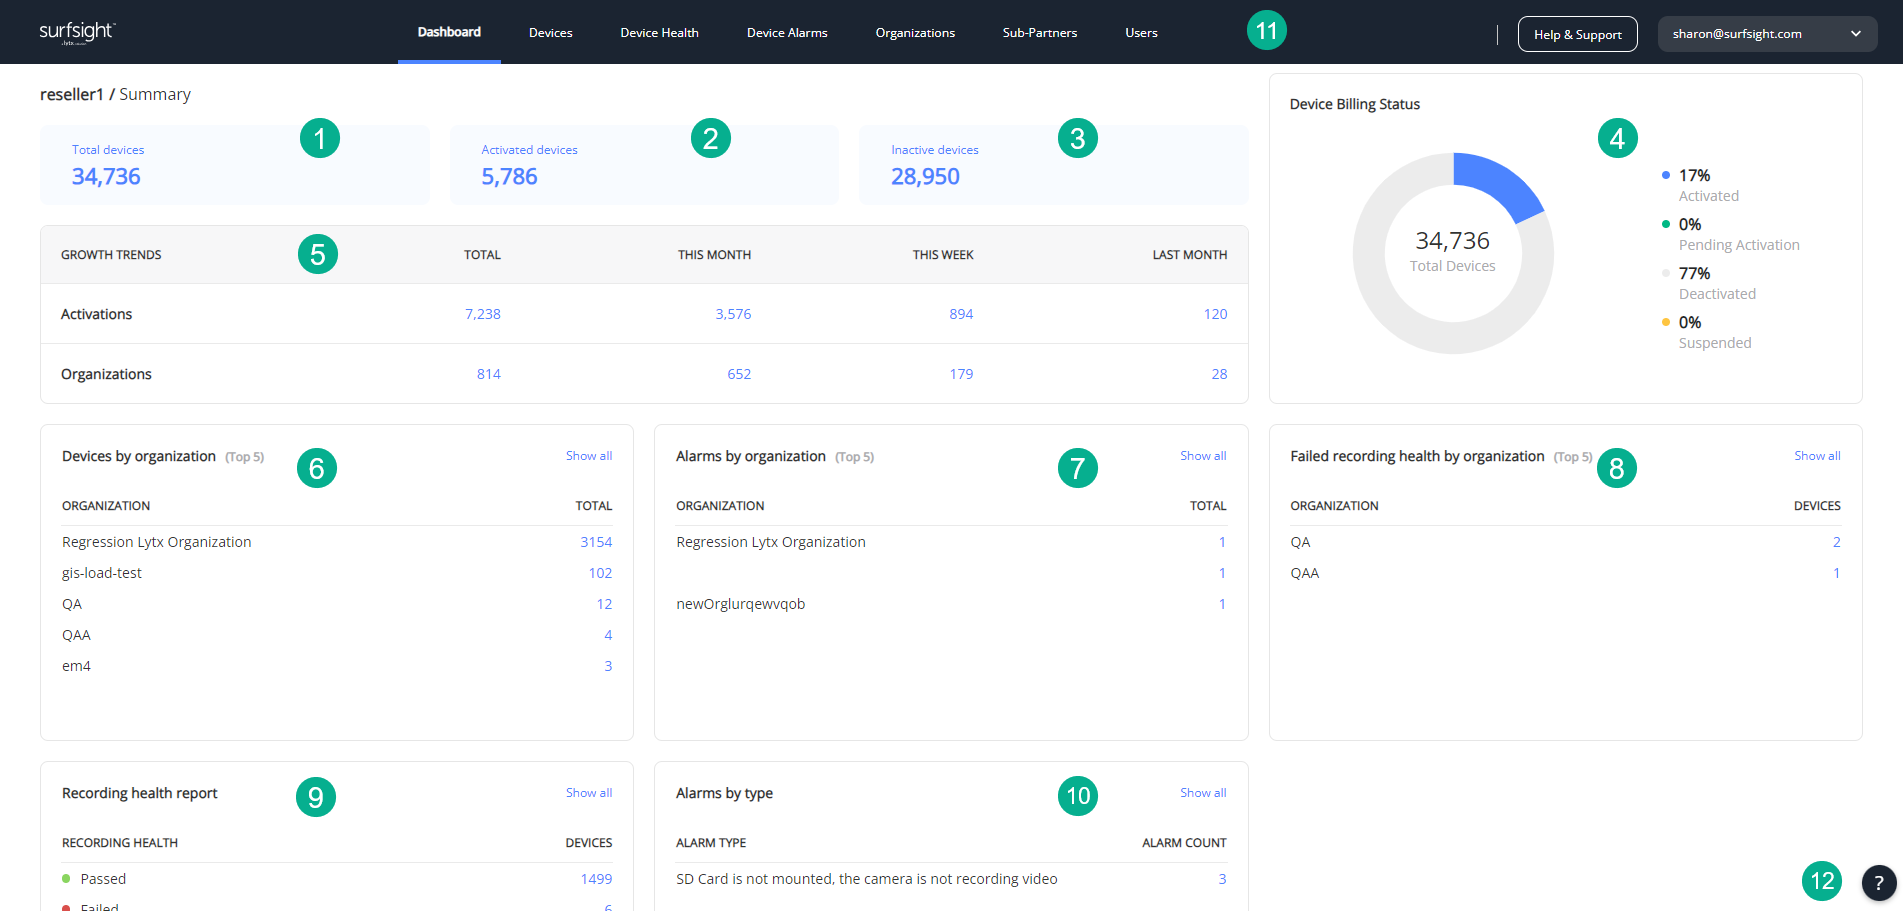
Quickly access additional details when you click any of the linked items across the different components of the dashboard. These different parts are described in the table below and marked in the following image:
Note
The table below references reseller partners and sub-partners. For more information about each, and the differences between the two, see Partner Portal roles.
Number | Component | Description |
|---|---|---|
1 | Total devices | The number of dashcams associated with the reseller partner or sub-partner. |
2 | Activated devices | The number of activated dashcams in your company. |
3 | Inactive devices | The number of inactive dashcams in your company. This includes dashcams that are Pending Activation, Deactivated, and Suspended. |
4 | Device Billing Status | The billing status of all the devices in your company, with a breakdown of how many are Activated, Pending Activation, Deactivated, and Suspended. |
5 | Growth trends | The number of dashcams device activations and organizations added. This section shows quantities for overall total, the current month, current week, and last month. Click the number under each time frame to view information for a specified component:
|
6 | Devices by organization | Shows the top 5 organizations with the most associated dashcams. Click:
|
7 | Alarms by organization | The five organizations with the most alarms associated with their dashcams. Click:
|
8 | Failed recording health by organization | The five organizations with the most failed recording health tests on their dashcams. Click:
|
9 | Recording health report | The breakdown of how many dashcams have passed or failed the recording health test, and how many have not been tested. Click:
|
10 | Alarms by type | Shows the number of open alarms (categorized by alarm type). Click:
|
11 | Navigation menu | The navigation menu, with links to all areas of the Partner Portal. |
12 | Help button | Click to open a documentation window with a Table of Contents and a Search bar to find specific text or a specific section. Click again to close the window |
The main menu
The dashboard header contains the menu. Click an item to go to the relevant screen.
 |
From the menu you can access:
Dashboard
Logout - click to log out of the app
Help & Support
The Help & Support menu is on the top right of the dashboard header. Click the button to open the dropdown to access:
Knowledge base
Business center
On demand training
Manage tickets